How to Use Python to Track Monthly Trends in Sales, HR, or Finance Data
Start with clean monthly data, or your trend report will lie to you If you want reliable monthly trends in Python, the first job is boring and completely non-negotiable:…
Home/Reporting and Visualization
12 articles
Start with clean monthly data, or your trend report will lie to you If you want reliable monthly trends in Python, the first job is boring and completely non-negotiable:…
Start here: the real difference between Matplotlib vs Seaborn When people search for matplotlib vs seaborn, they usually want a simple answer: which one should I learn fi…
Start with a report that answers the same questions every week If your weekly performance reports change shape every Friday, automation will feel harder than it is. The f…
Pick an export path that matches how people will actually read the report If you need to export charts Python can generate beautiful visuals fast, but the real decision i…
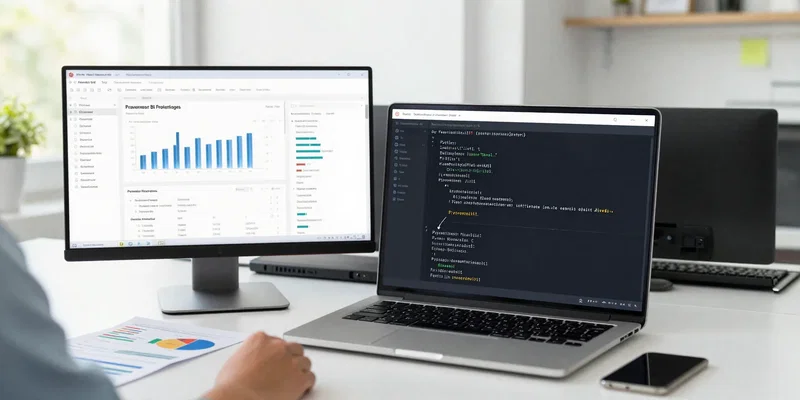
If your job is simple office reporting, start with Power BI first If you’re weighing power bi vs python for simple office reporting, the short answer is pretty straightfo…
Start With the Spreadsheet, but Don’t Let the Spreadsheet Dictate the Story If you want executive data visuals that actually get used, the first step is not picking a cha…
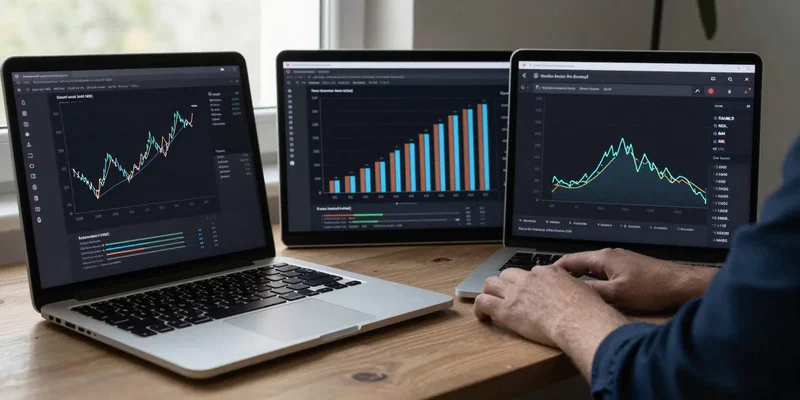
Stop Making Every Chart a Line Chart One of the most common data visualization mistakes beginners make in Python is picking a chart because it is easy to code, not becaus…
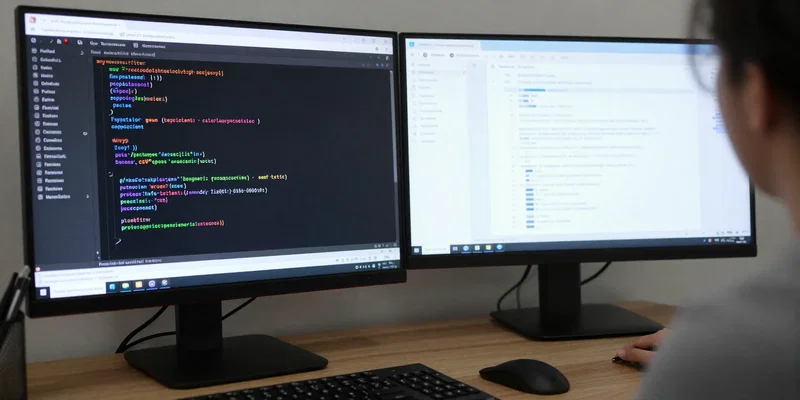
Start With a Pipeline, Not a Script If you’re trying to build a csv to chart python workflow, the first mistake is treating it like a one-off script. That works exactly o…

The breaking point arrives sooner than most teams expect Manual reporting problems usually look harmless at first. A weekly spreadsheet. A monthly KPI deck. A few copy-pa…
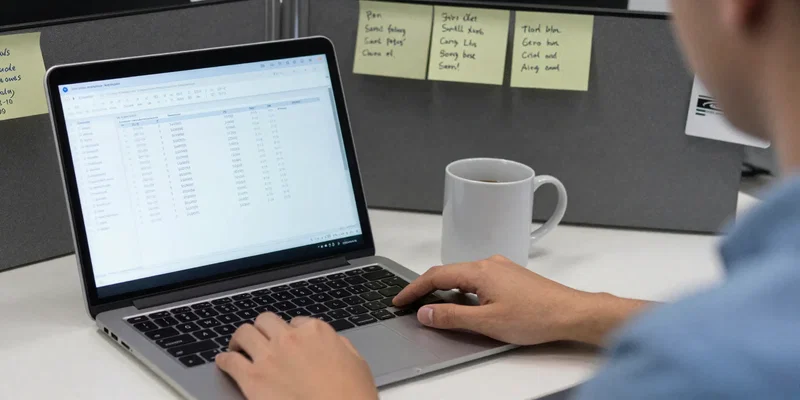
Start With a Small, Messy Dataset You Can Actually Finish If you want to go from raw data to dashboard without getting lost, pick a dataset that is boring in the best pos…
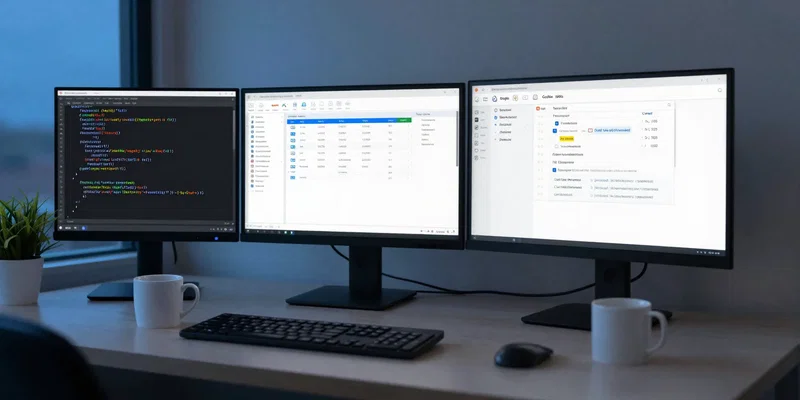
Pull data from five messy sources without touching a single spreadsheet tab If you want to automate reporting tasks before the week starts, this is where the real time sa…
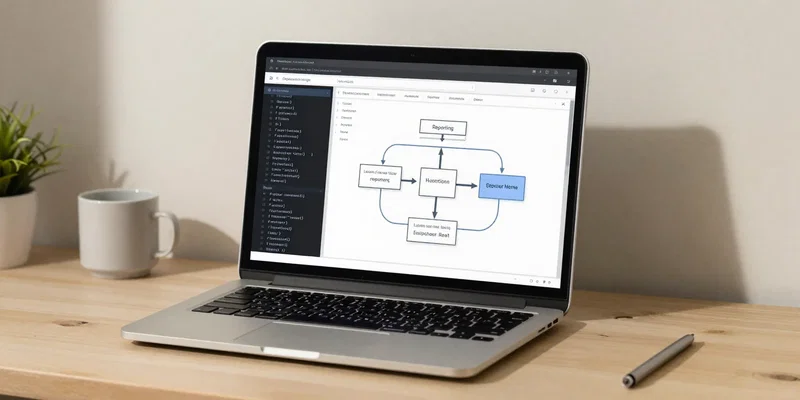
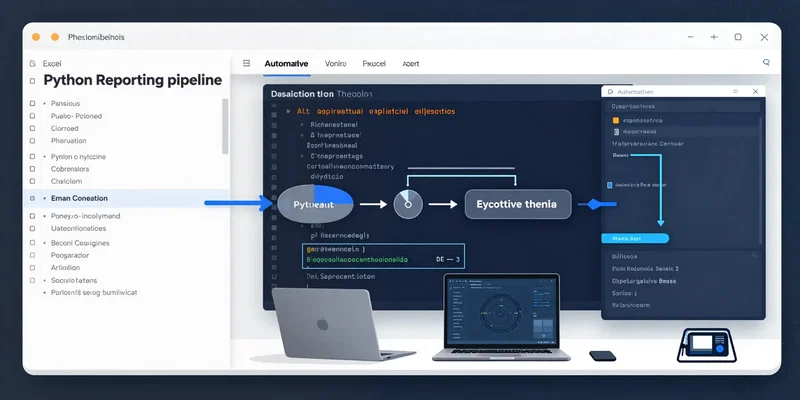
Start with a reporting workflow that’s boring on purpose If you want an end to end reporting python setup that actually survives contact with real work, keep it simple. T…